An Overview of the Map Viewer Features and Functions
Map Viewer is a single location to view 2D data products, such as RGB orthomosaics, DTMs, DSMs, contours, multispectral and thermal indices, as well as plan fights, view site locations, and more. Image analysis, flight planning, team collaboration, and drone data workflows that include things like reporting and historical records are all just a few clicks away within a single location known in Ground Control as the Map Viewer interface.
To get started in Map Viewer, click the Map link from the top navigation, and the screen will load the map interface. Map Viewer contains a variety of different workflows that can be used for many different applications, as well as benefit industries that manage a drone program. This article will cover the tools found in the Map Viewer interface including flight planning, data viewing, annotations, data management, sharing, and more.
Map Interface
Navigation Panel
On the left side of the screen is the primary navigation panel, which can be collapsed to increase the screen real estate for perhaps a more optimal map viewing experience. Within the primary navigation panel are the various layers that can be enabled and disabled by clicking the toggle next to the layer’s title, such as the toggle next to the data products title. Any related tools or processes can be found in the region that expands and populates below the title, as it relates to the layer’s intended functionality.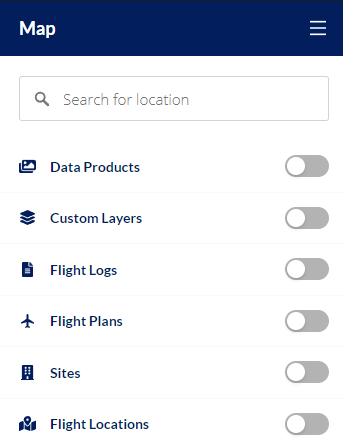
Search
The search bar is great for quickly looking up locations. Search for a location and hit Enter.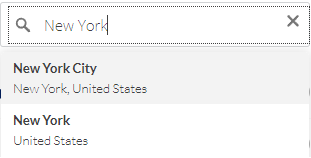
Data Products
To view data products that have been processed through Ground Control or to view previously processed data that has been imported into Ground Control, please make sure that the toggle is enabled, resulting in the button turning green. Please turn off the toggle to disable the layer.
3D data products may be imported and processed through Ground Control, but viewing 3D data products is currently unsupported. To view 3D data products, please click the link next to the data product name, and click “View in Pix4D”. Please be aware that any annotations made within Pix4D will not be saved in Ground Control. If your data product only includes 3D file outputs then navigate to the mission details page of the associated mission, click the Actions menu next to the data product name, and then click “View in Pix4D”.
Data Products Panel
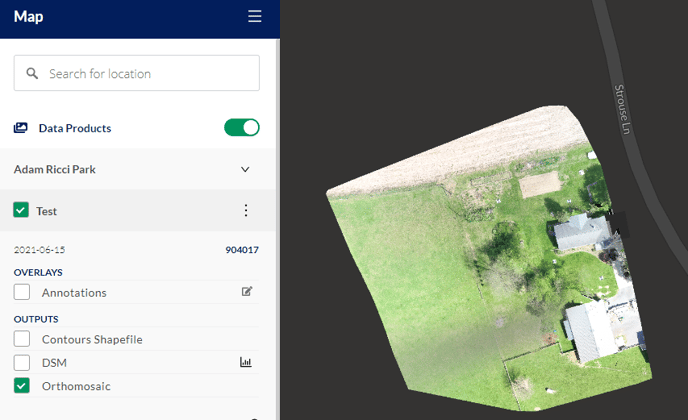
Data sets will appear dynamically based on the location displayed in the map. If no data populates in either the side panel list or on the map, please ensure that the map is oriented over a location where a data set was processed or imported into Ground Control.
A list of mission names will display below the data products header, containing any associated data products. These are listed in chronological order with the name that was assigned during the import or processing step. Turn on the individual data sets by clicking the checkbox next to the data product name. Similarly, the individual file outputs and overlays may be enabled or disabled by clicking the associated checkbox on or off.
Please note that layer loading may take time, depending upon the file size of the final stitched data output file. This will affect things like initial file load times, as well as zooming.
Below is a list of all the available output types currently available in Ground Control:
For RGB data:
- Orthomosaic
- DSM
- DTM
- Point Cloud (.LAS file)
- 3D Mesh
- Available as an SHP, DXF, and PDF
- Contours
- Available as an OBJ, DXF, PLY, and FBX
For Multispectral Data:
- Reflectance Map
- IR
- NDVI
- BNDVI
- GNDVI
- LCI
- NDRE
- SIPI2
- VARI
- Greyscale
- RGB
For Thermal Data:
- Thermal Index Map
- Reflectance Map
Annotations
For data sets where notes or team collaboration is needed, the Annotations tool sits above the file outputs in the overlays section. Annotations can be enabled or disabled all at once on the top panel under the Overlays title and within the Annotations subpanel, or individually when inside the Annotations sub-panel. Click the Edit icon next to the Annotations title to navigate to the Annotations sub-panel.
Click the + icon from the header to add a new annotation. The menu will open providing the option to draw an annotation with a polygon, a line, or a point on the map. Click the desired draw tool, and the crosshairs will engage. Click a single point, or series of points to draw the annotation into place on the map. To close a polygon, click on the first point that was created.
Once an annotation is drawn on the map, the new annotation is dropped into the Annotations list in the sidebar panel. Click on an annotation to edit the title, description, or to add an image and please remember to hit the Save button. Annotations can be deleted individually or all at once.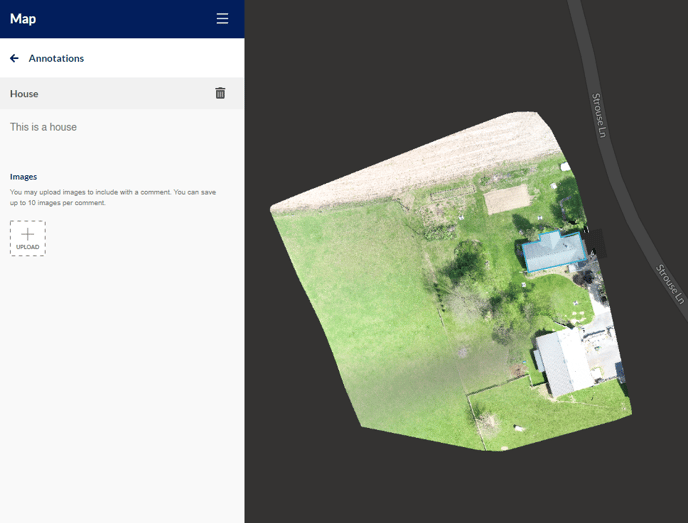
Compare Tool
If there are two or more data sets contained in a single Mission, then the Compare tool allows two data sets to be juxtaposed. Enable at least two data sets (if more than two are enabled then only the top two data sets will be compared), and click the Eye icon next to the Compare Data title. The comparison slider will turn on in the map window. Slide the handles left or right to swipe between the images. Please note that this is meant to compare data sets that were captured at the same location. To disable the swiper tool and remove it from the map view, click the Eye icon next to the Data Compare title, and ensure that the Eye icon has a line thru it.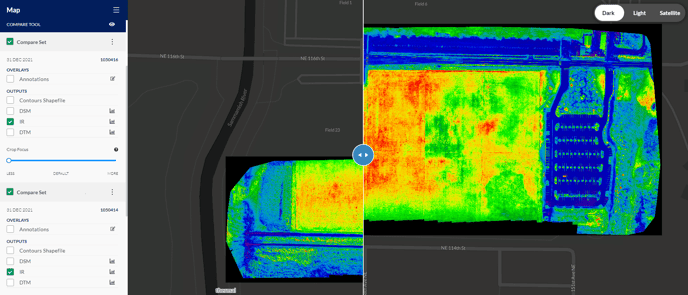
CropFocus
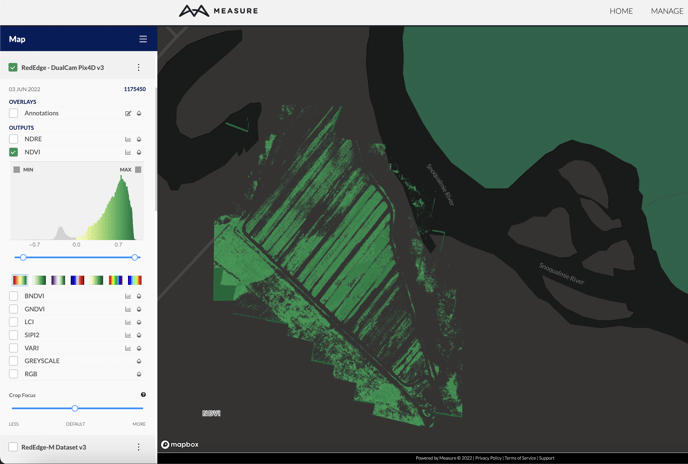
The CropFocus layer is an intelligent mask that works with any activated agricultural index layers (such as NDVI). This allows users to better interpret and showcase variability across the crop. By masking out soil, shadows, roads, and other non-agricultural features in the selected agricultural index, variability is exposed where it matters, as well as individual plant counts.
The default position of the slider has been designed to focus chosen agricultural index values solely on vegetation while blocking out most non-agricultural features. Moving the slider to the right will increase the effect of the mask, but does risk masking out the target vegetation. Moving the slider left lessens the effect of the mask, but does risk allowing more soil and other non-agricultural features to show through the mask. Sliding it all the way to the left, the mask will be disabled and index values will be displayed for each pixel of the captured data.
To give an example, if there is an NDVI output enabled, and it’s noticed that the mask does not appear to be covering the target crop (trees, vines, and other vegetation), reduce the mask until it is set to the appropriate NDVI values for the target crop. However, if the NDVI values are covering roads or soil, it is best to reduce or slide CropFocus to the right until the NDVI values cover just the target crop/vegetation.
Please note that when adjusting the CropFocus the histogram of the visible layers updates as well to represent the visible pixels.
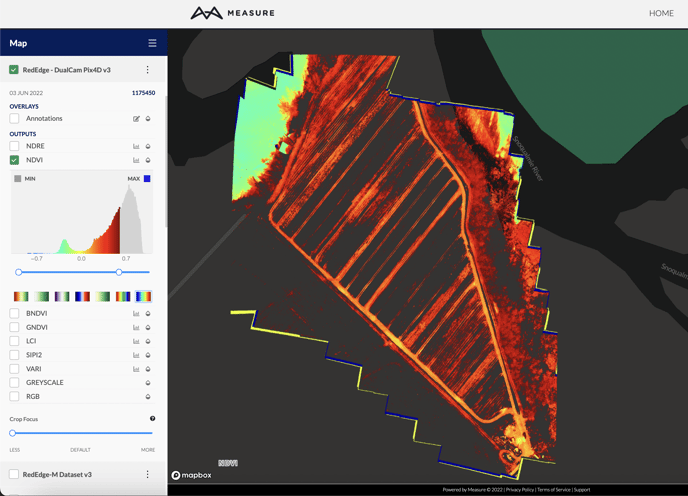
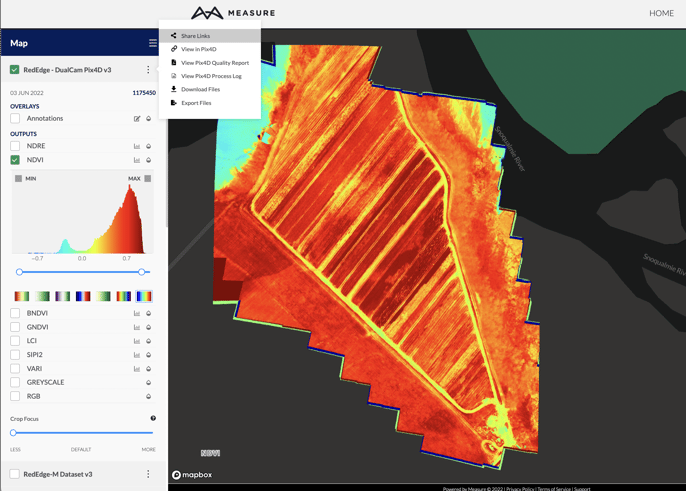
The Histogram Tool
The image histogram tool graphs the x-axis which represents the available range of possible pixel values, and the y-axis represents the total number of pixels in each specific value. In the example below, most of the pixels have a value in the lower to middle portion of the range.
Adjusting the dynamic range can help bring out details within the image, highlight certain aspects of the data, and even make visible artifacts beyond what the human eye can detect. The histogram control sliders can adjust the dynamic range by changing the minimum and/or maximum values. The maximum value represents the brightest display value and the minimum represents the darkest. Pixels above the maximum value will all be displayed with the same intensity as the maximum value, and the inverse is true for the minimum value.
The color palette (or gradient) helps to showcase subtle differences in values that would not be visible in grayscale. As the histogram range changes, the color palette changes to match so that the new range uses all of the colors of the chosen color palette. This effect can be useful to bring out variation in an area of interest, and could even be used for classification (for example, the various peaks in the histogram often distinguish between soil, road, and vegetation). The min/max values can also enable transparency for values beyond the minimum and maximum range by unchecking the min/max color swatch box.
Download Data
From the Actions sub-menu located next to any data product set, users can access the download tool. Each gives the option to download annotations, as well as select any combination of outputs files that were generated during the data processing job. 
Share Data
Measure Ground Control users can generate a link to share with other stakeholders and collaborators. This link gives non-Measure users access to view data products in the MGC Mapviewer. Pix4D also allows users to have access to the Pix4D Share Link. Located in the Actions submenu, clicking the link will copy the share link for the data set in Pix4D Cloud. To learn more about these features, see our article on the Share Tool.
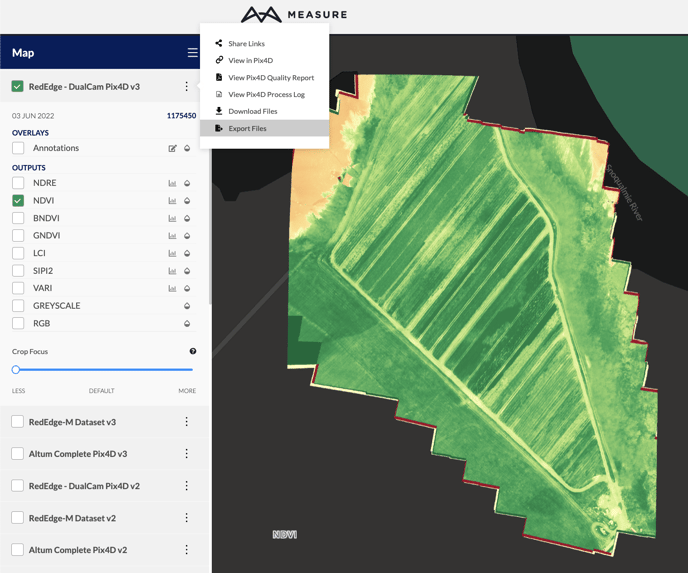
Export Data
Users can easily export and transfer data products to stakeholders and collaborators. The recipient will be able to quickly download the data products from their machine when data. is exported. Please see our knowledge base article on the Export Tool to learn more.
Processing Logs and Reports
For users that want more technical information on their data processing jobs, the Actions sub-menu has links to download the Pix4D Processing Logs, as well as the Quality Report.
Custom Layers
Thru an Enterprise subscription, Custom Layers can be imported and automated. For example, in instances where shapefile layers are used to represent property or crop boundaries, those features can be brought into the Map Viewer interface for boundary information. Enterprise customers have access to Ground Control’s API, which allows for interesting data flexibility options. Learn more about enterprise subscriptions by contacting support@measure.com.
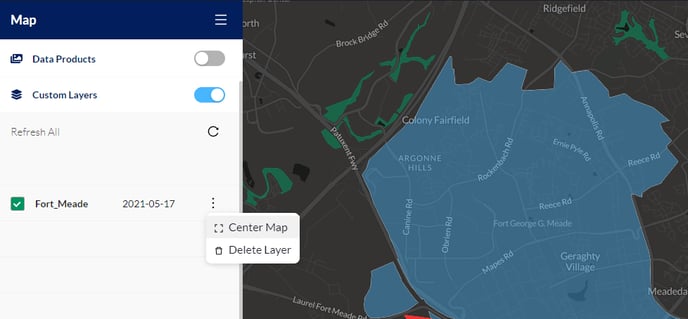
Example: Military Fort displayed as a custom boundary layer in blue.
Flight Logs
Flight logs are in the system as flown/logged with Measure Ground Control and contain any corresponding telemetry data that was collected during the flight. Flight Logs can also be imported after a flight or mission was completed. Enable the flight log layer, and flight logs associated with the map location will display. Each flight log flown within Measure Ground Control’s mobile app can be downloaded. Adjust the location orientation by clicking and dragging in the map or using the plus or minus sign to expand or contract the amount of area in the Map Viewer.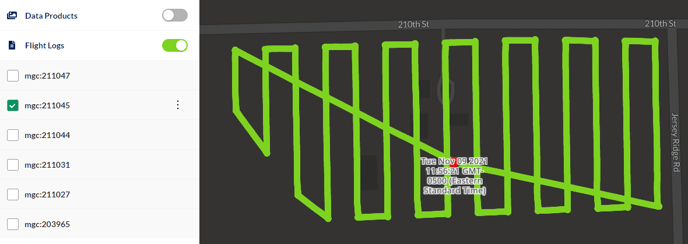
Flight Plans
Any automated flight plan created in Ground Control thru the web interface, or the mobile flight app, will be stored in the flight plan data and not permanently associated with a particular mission. Toggle the Flight Plans button to enable the flight plans associated with the area filtered by where the map view is centered. A list of existing flight plans will be dynamically displayed under the Flight Plan header. Re-orient or zoom the map to the appropriate location to find an existing flight plan, or to create a new flight plan.
Click the Create Flight Plan button to begin creating a new flight plan. Note that the option to duplicate or change an existing flight plan will occur on a subsequent screen. The main options for setting the flight location include a CSV or KML file upload, a latitude/longitude coordinate, or a street address. Once the location is confirmed, click the Start Planning Here button.
The next screen will load the settings screens for the flight path/area, as well as more configuration options for camera settings, and capture customizations. Additionally, the flight plan can be custom named, or associated with a specific mission for convenience. Data products must be associated with a mission, but flight plans can optionally be associated with a mission if required.
Click the control handles on the Flight Path polygon tool that is displayed by default in the Map Viewer. Configure the area as required by clicking any handle and adjusting its location or click on the solid dot in between the polygon handles to add an additional handle, then adjust to the desired location.
The data underneath the icons in the lower portion of the Flight Plans panel will update according to any adjustments made to the settings or the flight path with estimated coverage information. When the flight path and settings are configured, click the Save button to finish.
Flight plans can always be edited, downloaded, or deleted from the Actions menu next to the flight plan name.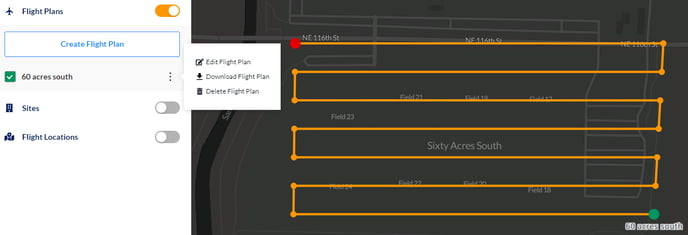
For more information, see Web-based Flight Planning.
Flight Locations
With the Flight Location layer enabled, all flight locations will display in the area visible in the Map Viewer, and from the list. The flight’s home location is represented by a blue dot and is created via the flight log. Adjust the location orientation by clicking and dragging in the map or using the plus or minus sign to expand or contract the amount of area in the Map Viewer.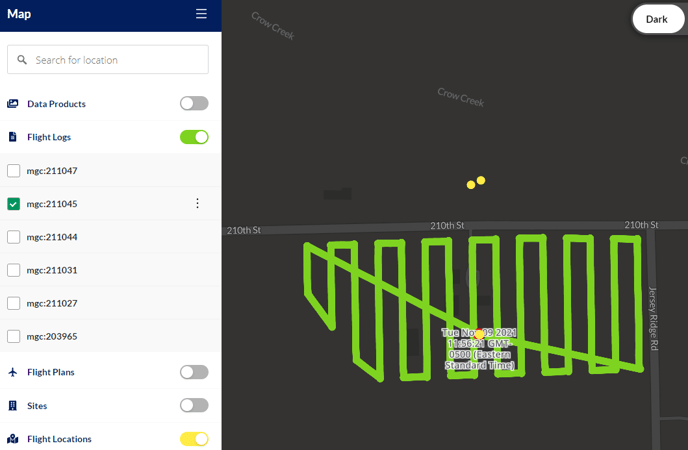
Sites
When the Sites layer is enabled, the map displays all Site locations stored in the system. Adjust the location orientation by clicking and dragging in the map or use the zoom controls to adjust the map extent in the Map Viewer.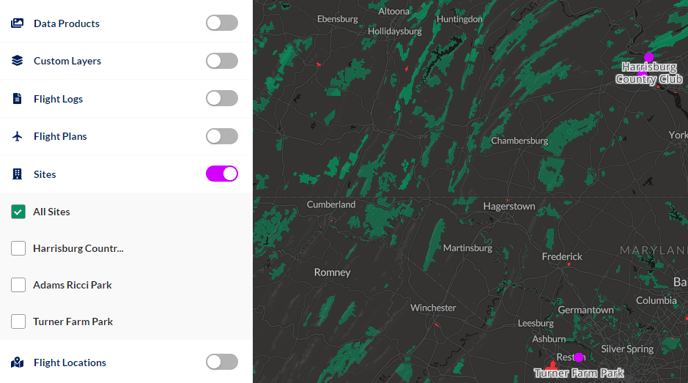
Related Articles
Have questions or feedback? Please contact support.groundcontrol@ageagle.com